V.L. Averbukh, S.S. Kumkov, V.S. Patsko, O.A. Pykhteev, D.A. Yurtaev
Specialized Visualization Systems for Differential Games
3rd IMACS International Multiconference on Circuits, Systems, Communications and Computers (CSCC '99)
(4–8 July 1999, Athens, Greece)
Download full text of the report (PDF format, 3638 KB)
Title

The report is mainly devoted to computer systems for
visualization of solutions of differential games of two classes.
Both classes give three-dimensional objects for visualization.
The main object of solution of any differential game is its value function.
So, to visualize the solution of a game means to visualize the value function
of the game. The value function is usually calculated numerically,
because its complete analitical computation can be made in very simple
cases only.
The first class consists of linear differential games with fixed terminal time.
Dynamics of such games can be reduced to two-dimensional in the case when
the terminal payoff function depends on two coordinates of the phase vector
at the terminal instant. So, two reduced coordinates and the time give
us three-dimentional game space.
The second class is two-dimensional pursuit-evasion games.
Here, we have three-dimensional space of two phase coordinates and
the meaning of the optimal result function.
Elaborated programs are joint work of scientists of the Dynamic
Systems Department and the System Software Department of
the Institute of Mathematics and Mechanics of the Ural Branch,
Russian Academy of Sciences, Ekaterinburg.
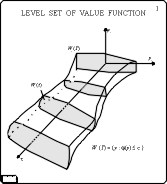
Level Set of Value Function
Slide 1

For linear differential game with fixed terminal time and payoff
function depending
on two coordinates of the phase vector, there are algorithms
allowing to calculate level sets of the value function.
Each level set can be imaginated as a tube in three-dimensional space
of the phase coordinates and time.
Algorithms give these tubes
as a set of polygonal sections orthogonal to the backward time \ tau axis.
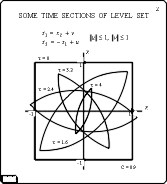
Some Time Sections of Level Set
Slide 2

These computational algoriths were developed in the middle of 80's.
At that time, computers did not allow to make good visualization.
So, usual way to see a level set was to look at a number of its
sections drawn in the plane of phase coordinates. Such pictures become
uninformative with growth of shown section quantity.
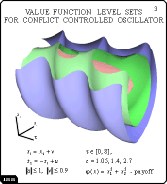
Value Function Level Sets
for Conflict Controlled Oscillator
Slide 3

Newly developed program allows to visualize a level set as a "smooth"
three-dimensional object. Also, it can draw a number of tubes simultaneously.
Visualization of Tubes
(Screenshot)
Slide 4

A screenshot of the main window of the program is shown in this slide.
Originally, this program was developed for Unix operational system
with Motif window manager. Further, it was ported to MS Windows
95/NT 4.0. The OpenGL language library was used for graphics.
In general, this program can show one or several level sets and
allows to change their orientation in the space, color,
opaqueness/transparency, position of light source, presence of contour
skeleton, presence of cutting plane.
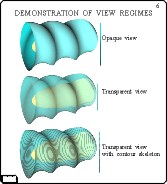
Demonstration of View Regimes
Slide 5

Also, there are a number of drawing regimes: namely, the "wire ring" regime,
the mesh regime and the solid one. The first regime is useful for primary
orientation of the objects, because drawing a solid tube takes
a time. When a proper view is found, the solid regime can be switched on.
The mesh view was made mainly for debugging proposals: to control how
the surface of a tube is recontructed from separate sections.
Demonstration of View Regimes
Slide 6

The program gives possibility to visualize several level sets
simultaneously. The first way is to draw opaque tubes,
but then the internal tubes are covered by external ones. To see
the whole structure, the external tubes can be made transparent.
But in this case, their three-dimensional structure can be lost.
To restore it, the contour skeleton can be shown.
Value Function Level Sets
for Conflict Controlled Oscillator
Slide 7

Another way to explore a number of tubes is to cut them by a plane
which position can be set by user.
Discontinuous Singular Line
Slide 8

This program gives opportunity to investigate
singularities of the value function. Usually, singularities appear
as non-smoothnesses of the surface of a level set.
Level Set with a "Throat"
Slide 9

Also, it is possible to explore narrow "throats" of level sets by means
of the program.
Four "Drawing Pins"
Slide 10

Quick and accurate interactive visualization allows to see the dependence
of level sets on parameters of the game.
The second problem is connected to visualization of the graph of the value
function in time-optimal games of the second order on the phase variable.
The payoff function is the time of approaching the terminal set. In the
Institute of Mathematics and Mechanics, backward
algorithms for constructing fronts of level sets of the value function are
elaborated. Fronts are computed on a time grid. Each front is a polygonal
line defined by its vertices. Neighbor fronts can have different number of
connected components. Visualization program using the data on the fronts
approximates the graph of the function and shows it. The graph is usually
a complicated surface in three-dimensional space.
Below, there are the results of application of this program to
two games with the "homicidal chauffeur" dynamics.
The collections of the fronts for the following pictures were
calculated by V.L.Turova.
Time Optimal Game Problem
(Homicidal Chauffeur Game)
Slide 11

Here, the fronts for the classic "homicidal chauffeur" problem
are shown. The termial set denoted by \M is egg-like.
The fracture line of fronts can be seen. Also, areas of
the front accumulation are evident. But from the picture, it is
unclear whether the value function is conitunuous there or not.
Visualization of Optimal Result Function
(Screenshot)
Slide 12

This slide contains the screenshot of the main window of the program
with three-dimensional picture corresponding to the fronts from the
previous slide. Now, it is obvious that the value function is
continuous.
The program has controls for changing the viewpoint, the direction of sight,
the properties of the surface, the location of the radiant, etc.
There is a painting regime when the surface color changes with the meaning
of the drawing function. Fronts can be drawn in the horizontal plane.
"Homicidal Chauffuer" Game Value Function
Slide 13

In this slide, a graph of the value function for the same game,
but with the terminal set taken as a very small circle moved away
the origin, is presented.
During the evolution, an instatnt appears when the front touches itself.
After that, the fronts become disconnected and are divided into two parts:
internal and external. In this picture, the internal area is fully
filled. The external parts of the fronts are not shown after the touch
instant. Here, the structure of the value function in the central area
is of great interest.
Value Function for a Variant of the "Homicidal Chauffuer" Game
Slide 14

Here, the value function graph is shown for modified "homicidal chauffeur"
problem suggested by P.Bernhard. In this problem, the constraints for the
second player (evader) velocity depends on the distance to the
first player (pursuer). In the reduced coordinates, the dependence is on
the distance from the system position to the origin. The terminal set
is a rectangle stretched along the first coordinate axis.
In this case, the value function is finite in front of
the terminal set. Behind it, there are infinitely growing "petals".
On the surface of the graph, there are contours of level lines.
Value Function for a Variant of the "Homicidal Chauffuer" Game
Slide 15

For the same dynamics, a bit different parameters of the second
player constraints are taken.
Now in the front of the terminal set, a "smoke-stack" is appeared,
inside which the value function is infinite.
S.S. Kumkov, V.S. Patsko
Institute of Mathematics & Mechanics Ural Branch of RAS
S.Kovalevskaya str.16
620219 Ekaterinburg, Russia
e-mail:
sskumk@gmail.com
patsko@imm.uran.ru


